Originally posted by theEnot
Hi, can someone explain?Range 1: AA-55,AKs-A2s,KQs-KTs,QJs-QTs,JTs,T9s,98s,AKo-AJo,KQo,[50]44-22,97s,ATo,KJo[/50],[50]K9s,Q9s,J9s,T8s,87s,76s,65s,QJo[/50],[20]54s[/20]
Range 2: TT-77,AQs-ATs,KQs-KJs,QJs,JTs,AQo,[10]AA-KK,A7s[/10],[50]QQ,55-44,A9s,KTs,QTs,T9s,98s,87s[/50],[75]JJ,66,AKo[/75],[25]33-22,AKs,A8s,A5s-A3s,J9s,T8s,76s,65s,54s,KQo[/25]
Board: 4d3c2cResults in Equilab:
Spoiler
Board: 4d3c2c
Equity Win Tie
MP2 48.58% 45.95% 2.63% { <b>100: </b>55+, A2s+, KTs+, QTs+, JTs, T9s, 98s, AJo+, KQo,<b> 50: </b>44-22, K9s, Q9s, J9s, T8s, 97s, 87s, 76s, 65s, ATo, KJo, QJo,<b> 20: </b>54s }
MP3 51.42% 48.78% 2.63% { <b>100: </b>TT-77, AQs-ATs, KJs+, QJs, JTs, AQo,<b> 10: </b>KK+, A7s,<b> 75: </b>JJ, 66, AKo,<b> 25: </b>33-22, AKs, A8s, A5s-A3s, J9s, T8s, 76s, 65s, 54s, KQo,<b> 50: </b>QQ, 55-44, A9s, KTs, QTs, T9s, 98s, 87s }
Results in Fz (and crev):
Spoiler
Equity is different. Graphs is critically different.
Weights is similar, but results aren't. Why?


Hi theEnot,
you're right, there were some small deviations while calculating with nested, weighted ranges. This is solved in the newest version 1.10.13.0.
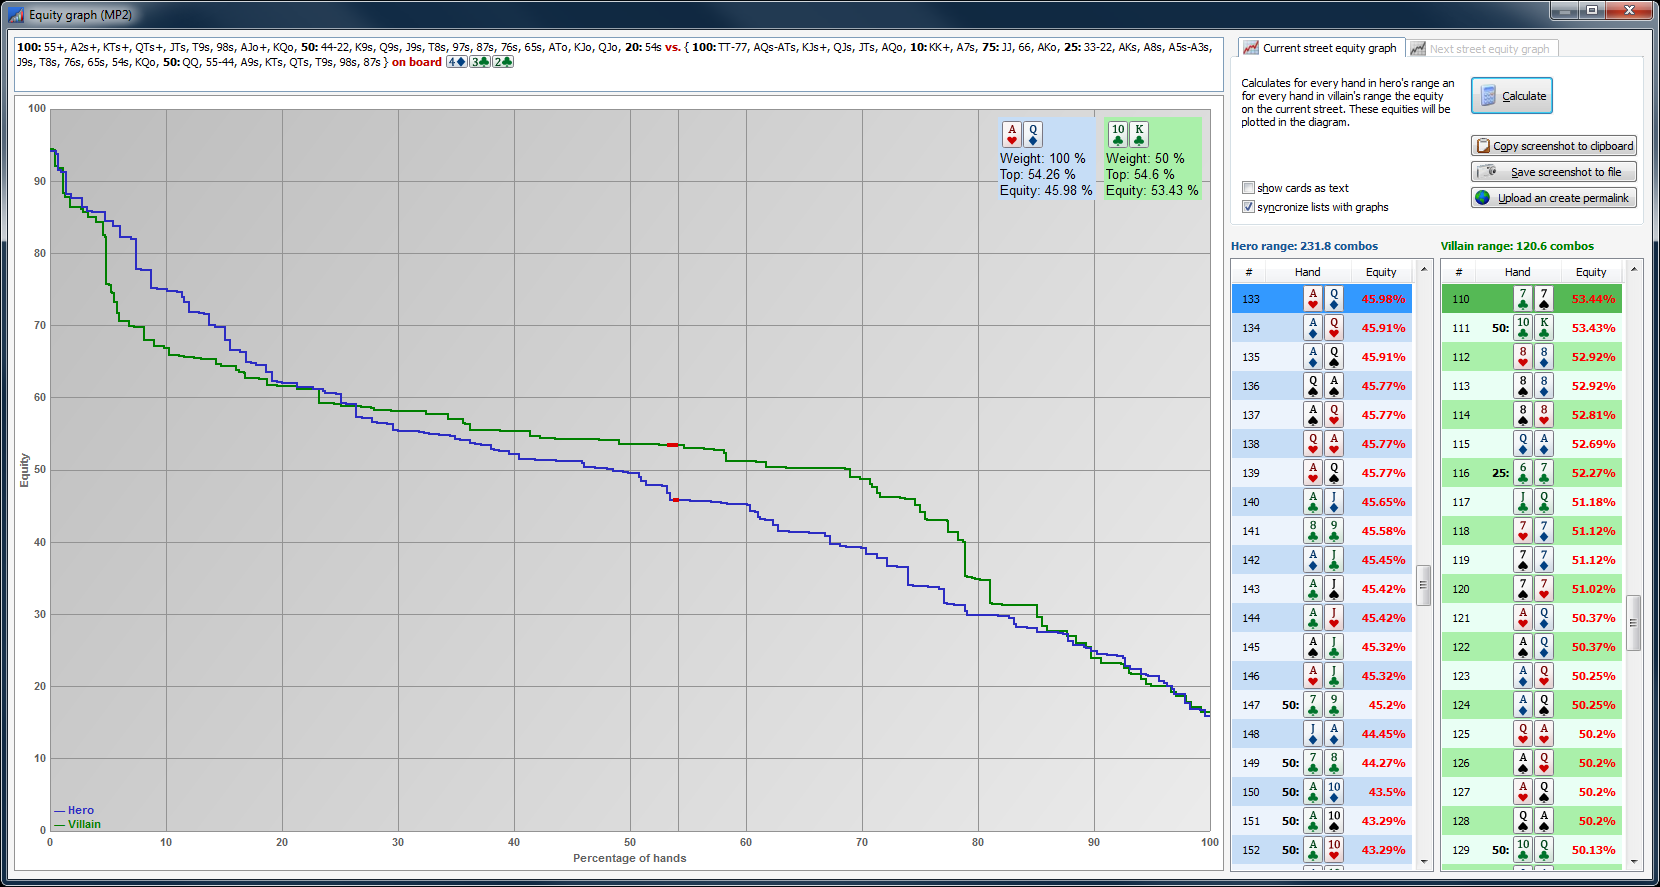
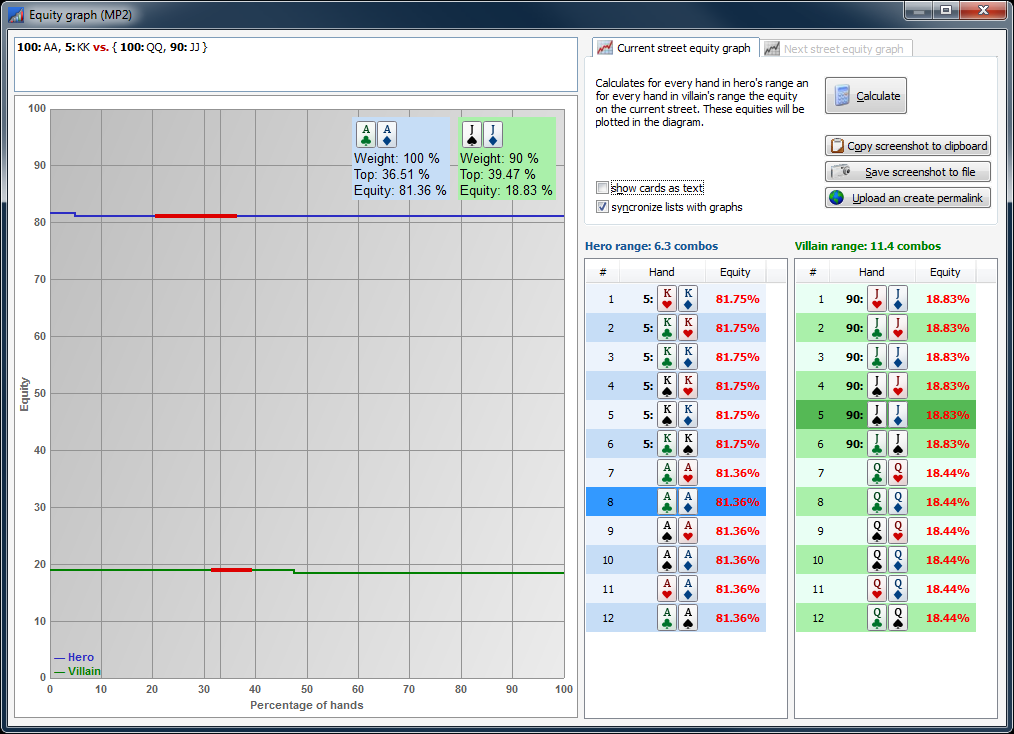
The second thing is the equity graph. We are pretty sure, that the visualizing in the Power-Equilab is correct.
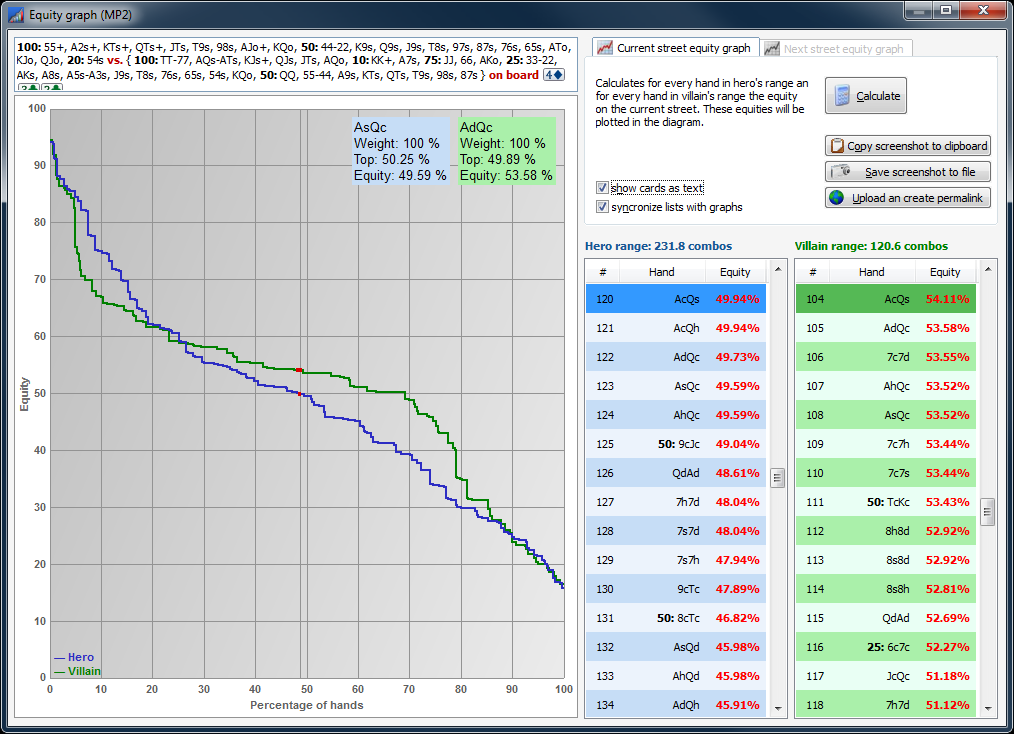
We have no ides in which manner the holdeq paint the values, but it seems to be a litte weired. Please take a look to the follwing screenshot:
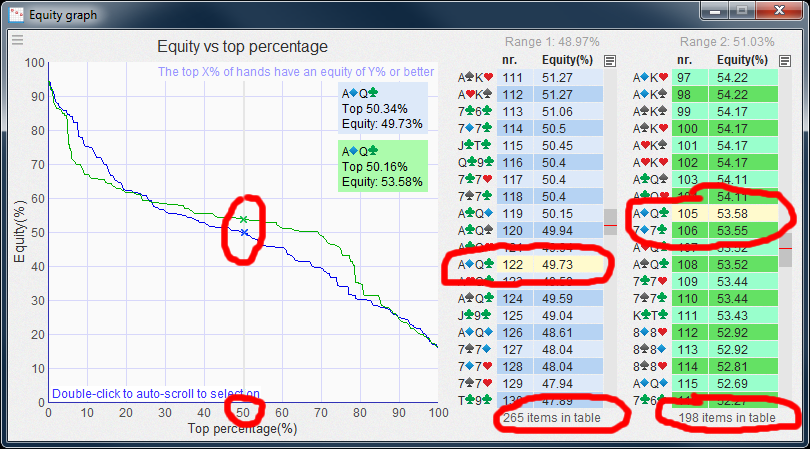
As you can see, we have moved the cursor exact to 50%. We would expect, that the expected values is 50% out of 265 items = 132 or 133. but here is visualised no 122. The same for the right side: 105 instead of 50% of 198 = 99.
We think the differences are caused by the different painting methods.
best regards, nopi