
well not a graph but pretty cool nonetheless for 35min work ♦

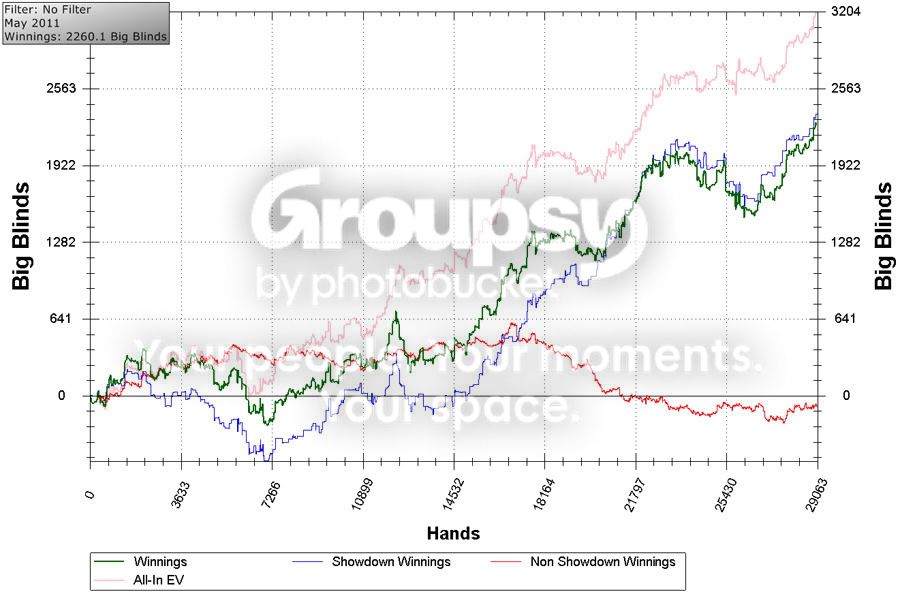
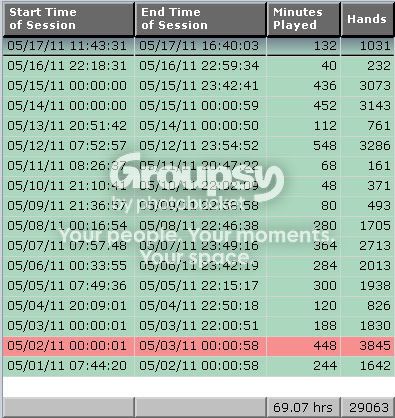
This month is my good month though my bi winning is low... I usually win 5 days and lose 2 days every week.
Graph:
Session:
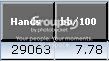
bb/100 Report:


Not a one day success, but it's me getting out of -28BI downswing (playing NL100) in around a week. It's a good week I would say 

Uploaded with ImageShack.us
I'm finished with my downswing too ♦ it wasn't 28 BI (quite sick IMO), but still ♦
BTW why nobody told me that NL 100 FR is super easy?? Instead of playing superaggressive game at SH with very good regs, I can just stack those spewy midstacks and stupid regs that dont know how to adapt against LAG ♦
why do so many people here not understand the word 'day'?
seriously, would be more fun if you actually posted DAYs here, not months etc
Originally posted by Kruppe
why do so many people here not understand the word 'day'?seriously, would be more fun if you actually posted DAYs here, not months etc
What are you on about? This was for a day 
 @ some of graphs above.
I'm posting my first 3 days of no-lifing graph. (that is my bankroll, not winnings), don't use any poker programs,
because they just disturb my thinking, so made this one by my hand.

NL25, 12 tabling
It's insane, I did in one day what I would use a week 4 tabling. Though I did play like an obsessed for 10 hours without eating, drinking or taking a trip to the toilet.
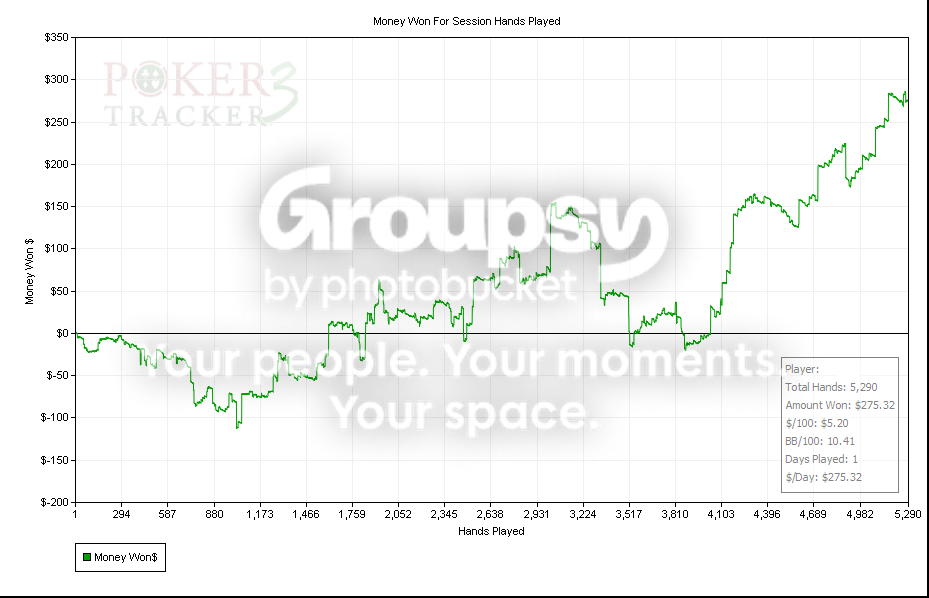
Can't seem to get a graph from HEM to paste from OpenOffice to here. I tried copy/paste to OpenOffice.orgDraw but no joy. Maybe someone knows how?
Anyway, losing slowly for a while then played these 3 sessions in one day.
I played nl4 6x6 max to start but dropped to 8xFR when BR went west second session.
Start BR $107
Session 1: -$14.81
Session 2: -$28.29 after 1hr then
+$93.35.